This is the first part of our real-time data series. The second part in the series covers use cases for your real-time data.
In the Discovering Real-Time Data in Your Apps post I covered what is real-time and discovering the real-time data within your existing apps. In this second post I want to cover ways in which you can use the real-time data that you have now identified within your apps. Specifically, how you can use that data to understand what’s happening right now in your apps and how it enables you to build awesome real-time features for your customers.
What’s Happening Right Now in Your Apps?
It’s really important to know what’s happening in your application. The most common example of this is being notified if anything is going wrong; from infrastructure issues like CPU, memory or disk usage through to in-application warnings, errors and exceptions. These events are highly important as they may directly impact your business and customers.
From the first post in the series we all now know that when any event takes place with an application there is an associated data payload and therefore real-time data. This information may be available in a number of ways, but one of the most common way is through some sort of logging solution: system stat logs, access logs and application logs.
Having logs let you analyse what has happened in the past, but that could be too late if your customers have been impacted by system downtime or a broken feature. Email notifications telling your team something is going awry are fine and are indeed useful. But there’s much more that you can do to act as things are happening or better still, before they’ve happened.
Real-Time System Analytics
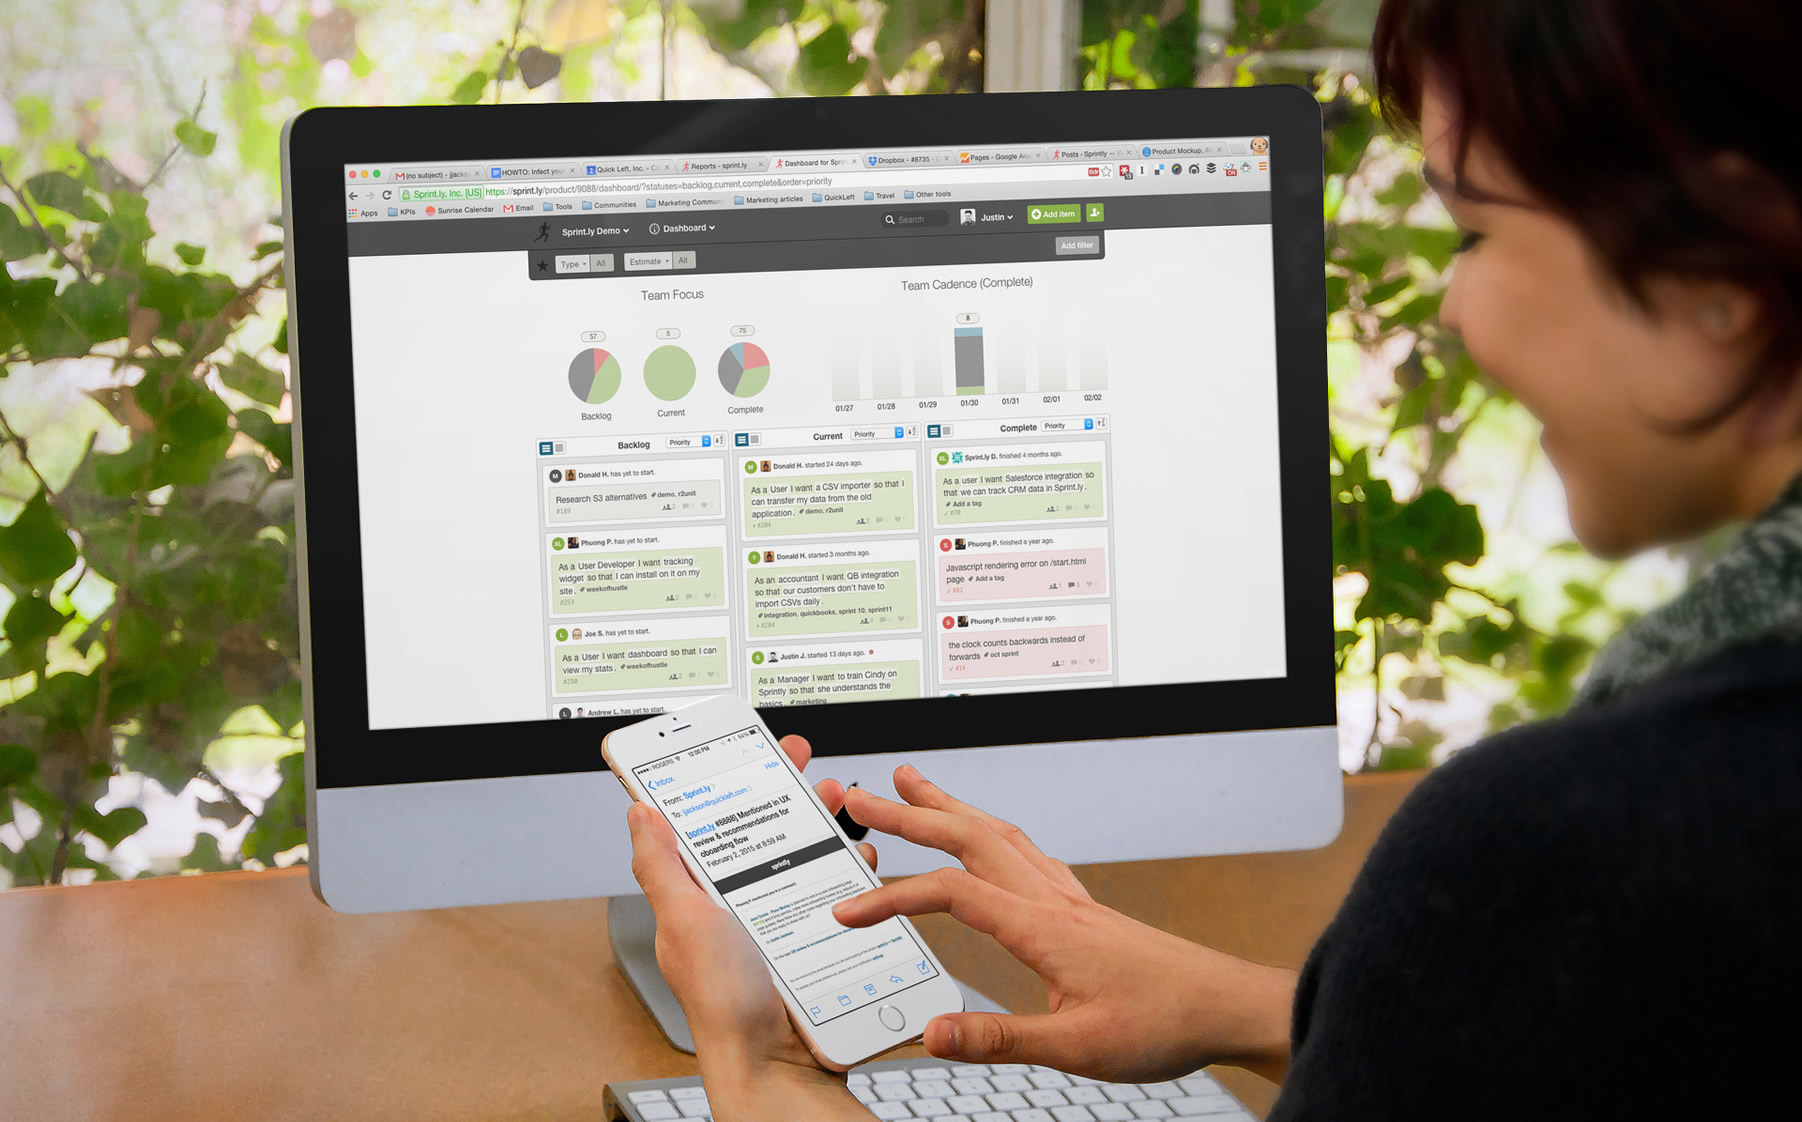
There’s something reassuring about dashboards. A dashboard that’s showing the correct selection of information can give you a highly informative view of the status of your application. It lets you see what’s happened in the past and identify potential trends. Add real-time data and it lets you see what’s happening right now and enables you to be much more reactive to potential issues, or indeed opportunities.
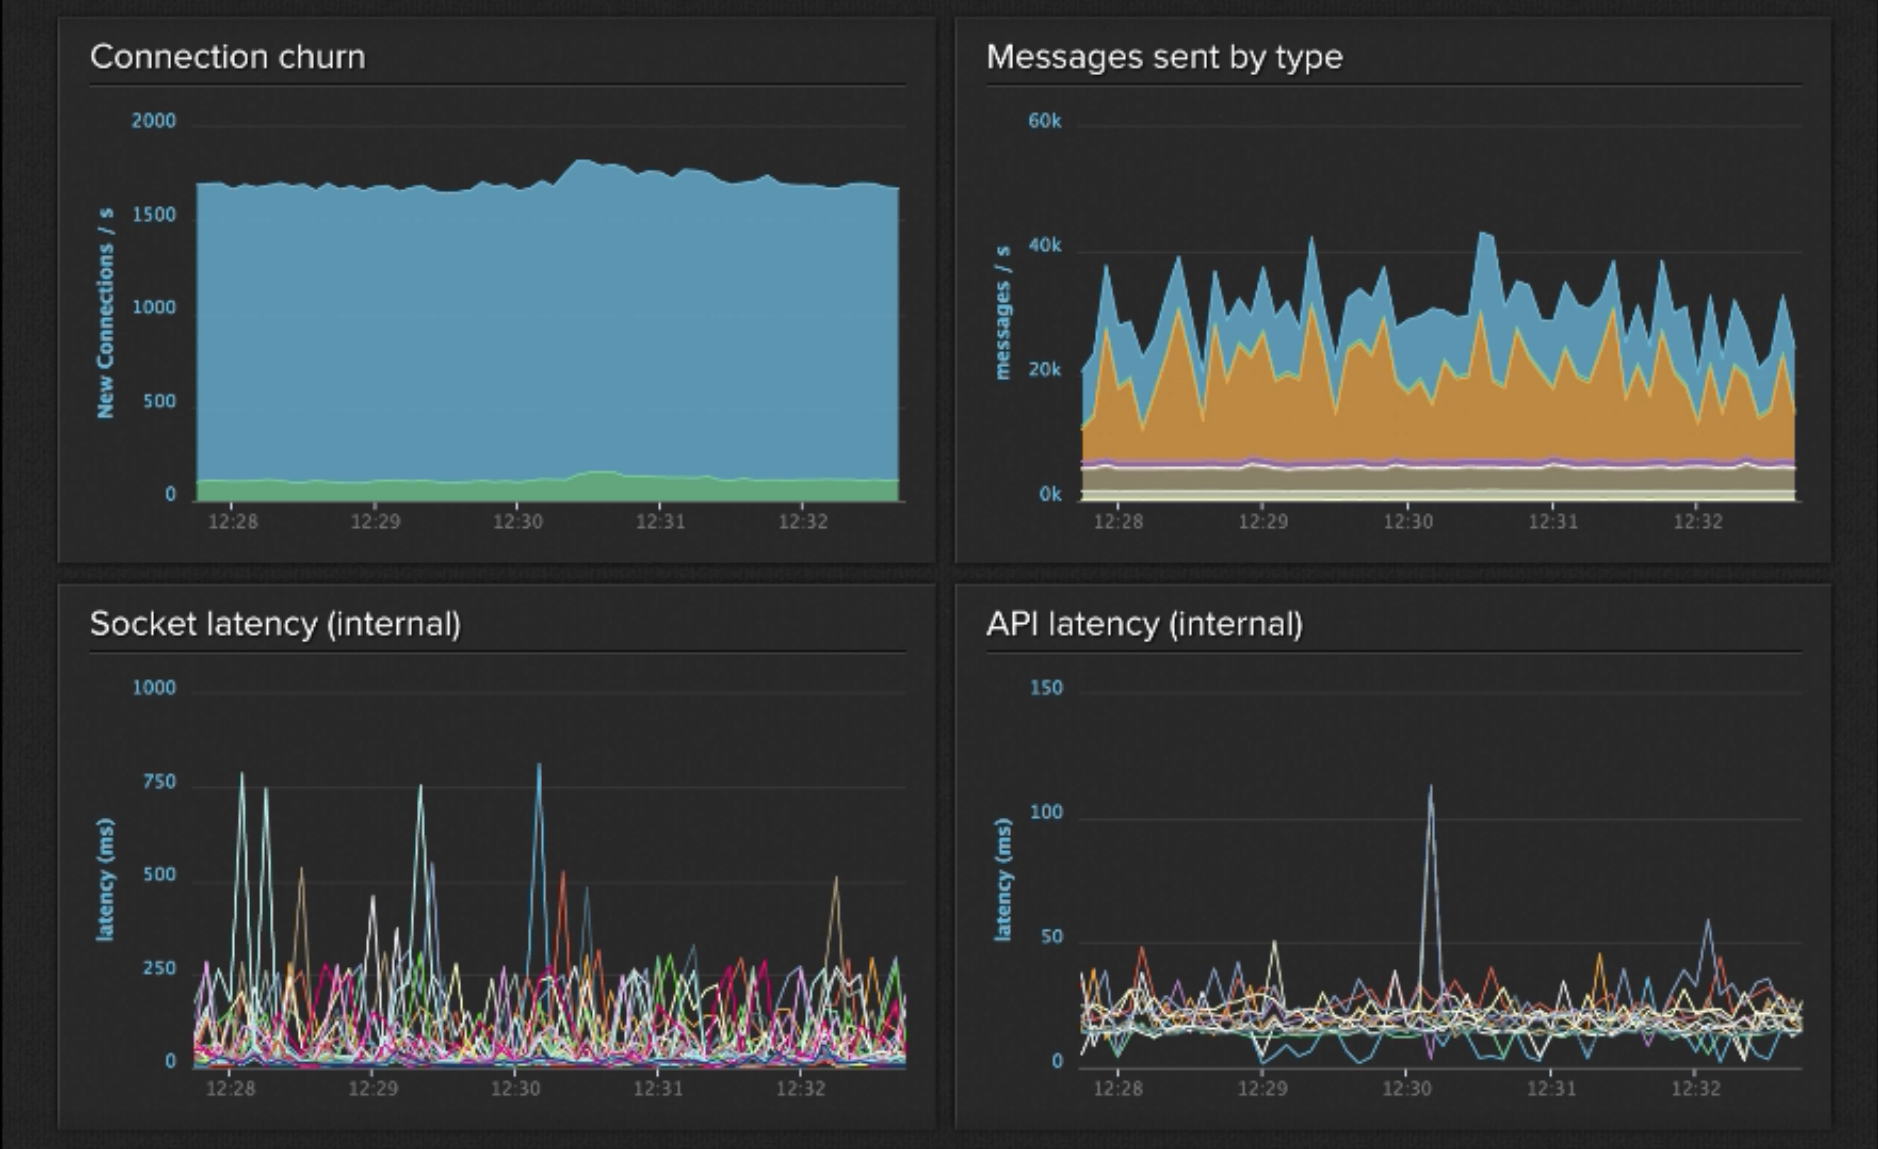
Many companies use Librato to monitor a whole host of information; the status of the machines that make up our infrastructure, the number of persistent connections we’re maintaining, socket churn, the number of messages (events) we’re sending, system latency and much more. We of course have monitoring systems with pre-defined thresholds in place. But we also find that having a visual representation of what’s going on to be highly valuable for status updates, right after deployment to ensure unexpected things aren’t showing an unwanted upwards trend and during times when we’re trying to track down the cause of a problem.
You could use a solution like Librato, Graphite or statsd for your system analytic dashboard, use a combination of these or build your own entirely. In some cases you could build your own real-time system analytics dashboard and deliver real-time data updates to it with real-time web technology.
Real-Time App Analytics
Most of us use some form of application analytics to identify how your application is being used, what features are most popular and which ones aren’t, if a promotional activity meet its goals and much more. Some analytics tools such as: Google Analytics, Clicky, Chartbeat and GoSquared offer real-time analytics. These let you know what users are doing right now in your app.
Here are a few examples of the potential benefits of real-time analytics:
Has the usage of a feature – or the app as a whole – change just after pushing out a new version? Does it mean that a change has negatively impacted how accessible it is, or is there a chance something has broken? Real-time application logging and usage analytics will tell you.
You’ve just kicked off an advertising campaign with a goal to get more users to sign up. You can see a spike in website traffic, but your real-time analytics show you those visits aren’t converting to signups. You can instantly react by either tweaking the campaign (maybe the landing page) or cancelling the advertisement to save money.
You can either use one of these existing tools for your real-time analytics, or for a more customised approach you could try combining services like Keen IO and a real-time web technology.
Building Awesome Features For Your Customers
Although there’s clearly a benefit from using your new found data internally, the biggest benefits from a product and customer point of view are likely to be seen when you use that data to build new, exciting, productive and potentially interactive features for your applications.
So, how is real-time data generally used within applications? What are the most common use cases? Here are a few examples:
Signalling
When something has happened within one component or system and you need to instantly inform another component or system you can signal them. A signal can contain a data payload but it doesn’t necessarily need to/ The fact a signal has been received may be enough on it’s own; think lighting beacons across the hilltops to indicate an enemy is approaching.
In these use cases there may not be any visual indication that something is happening, but a new workflow may start following the signal.
Do you have real-time data within your systems that could be used to signal other processes to take place?
User Notifications
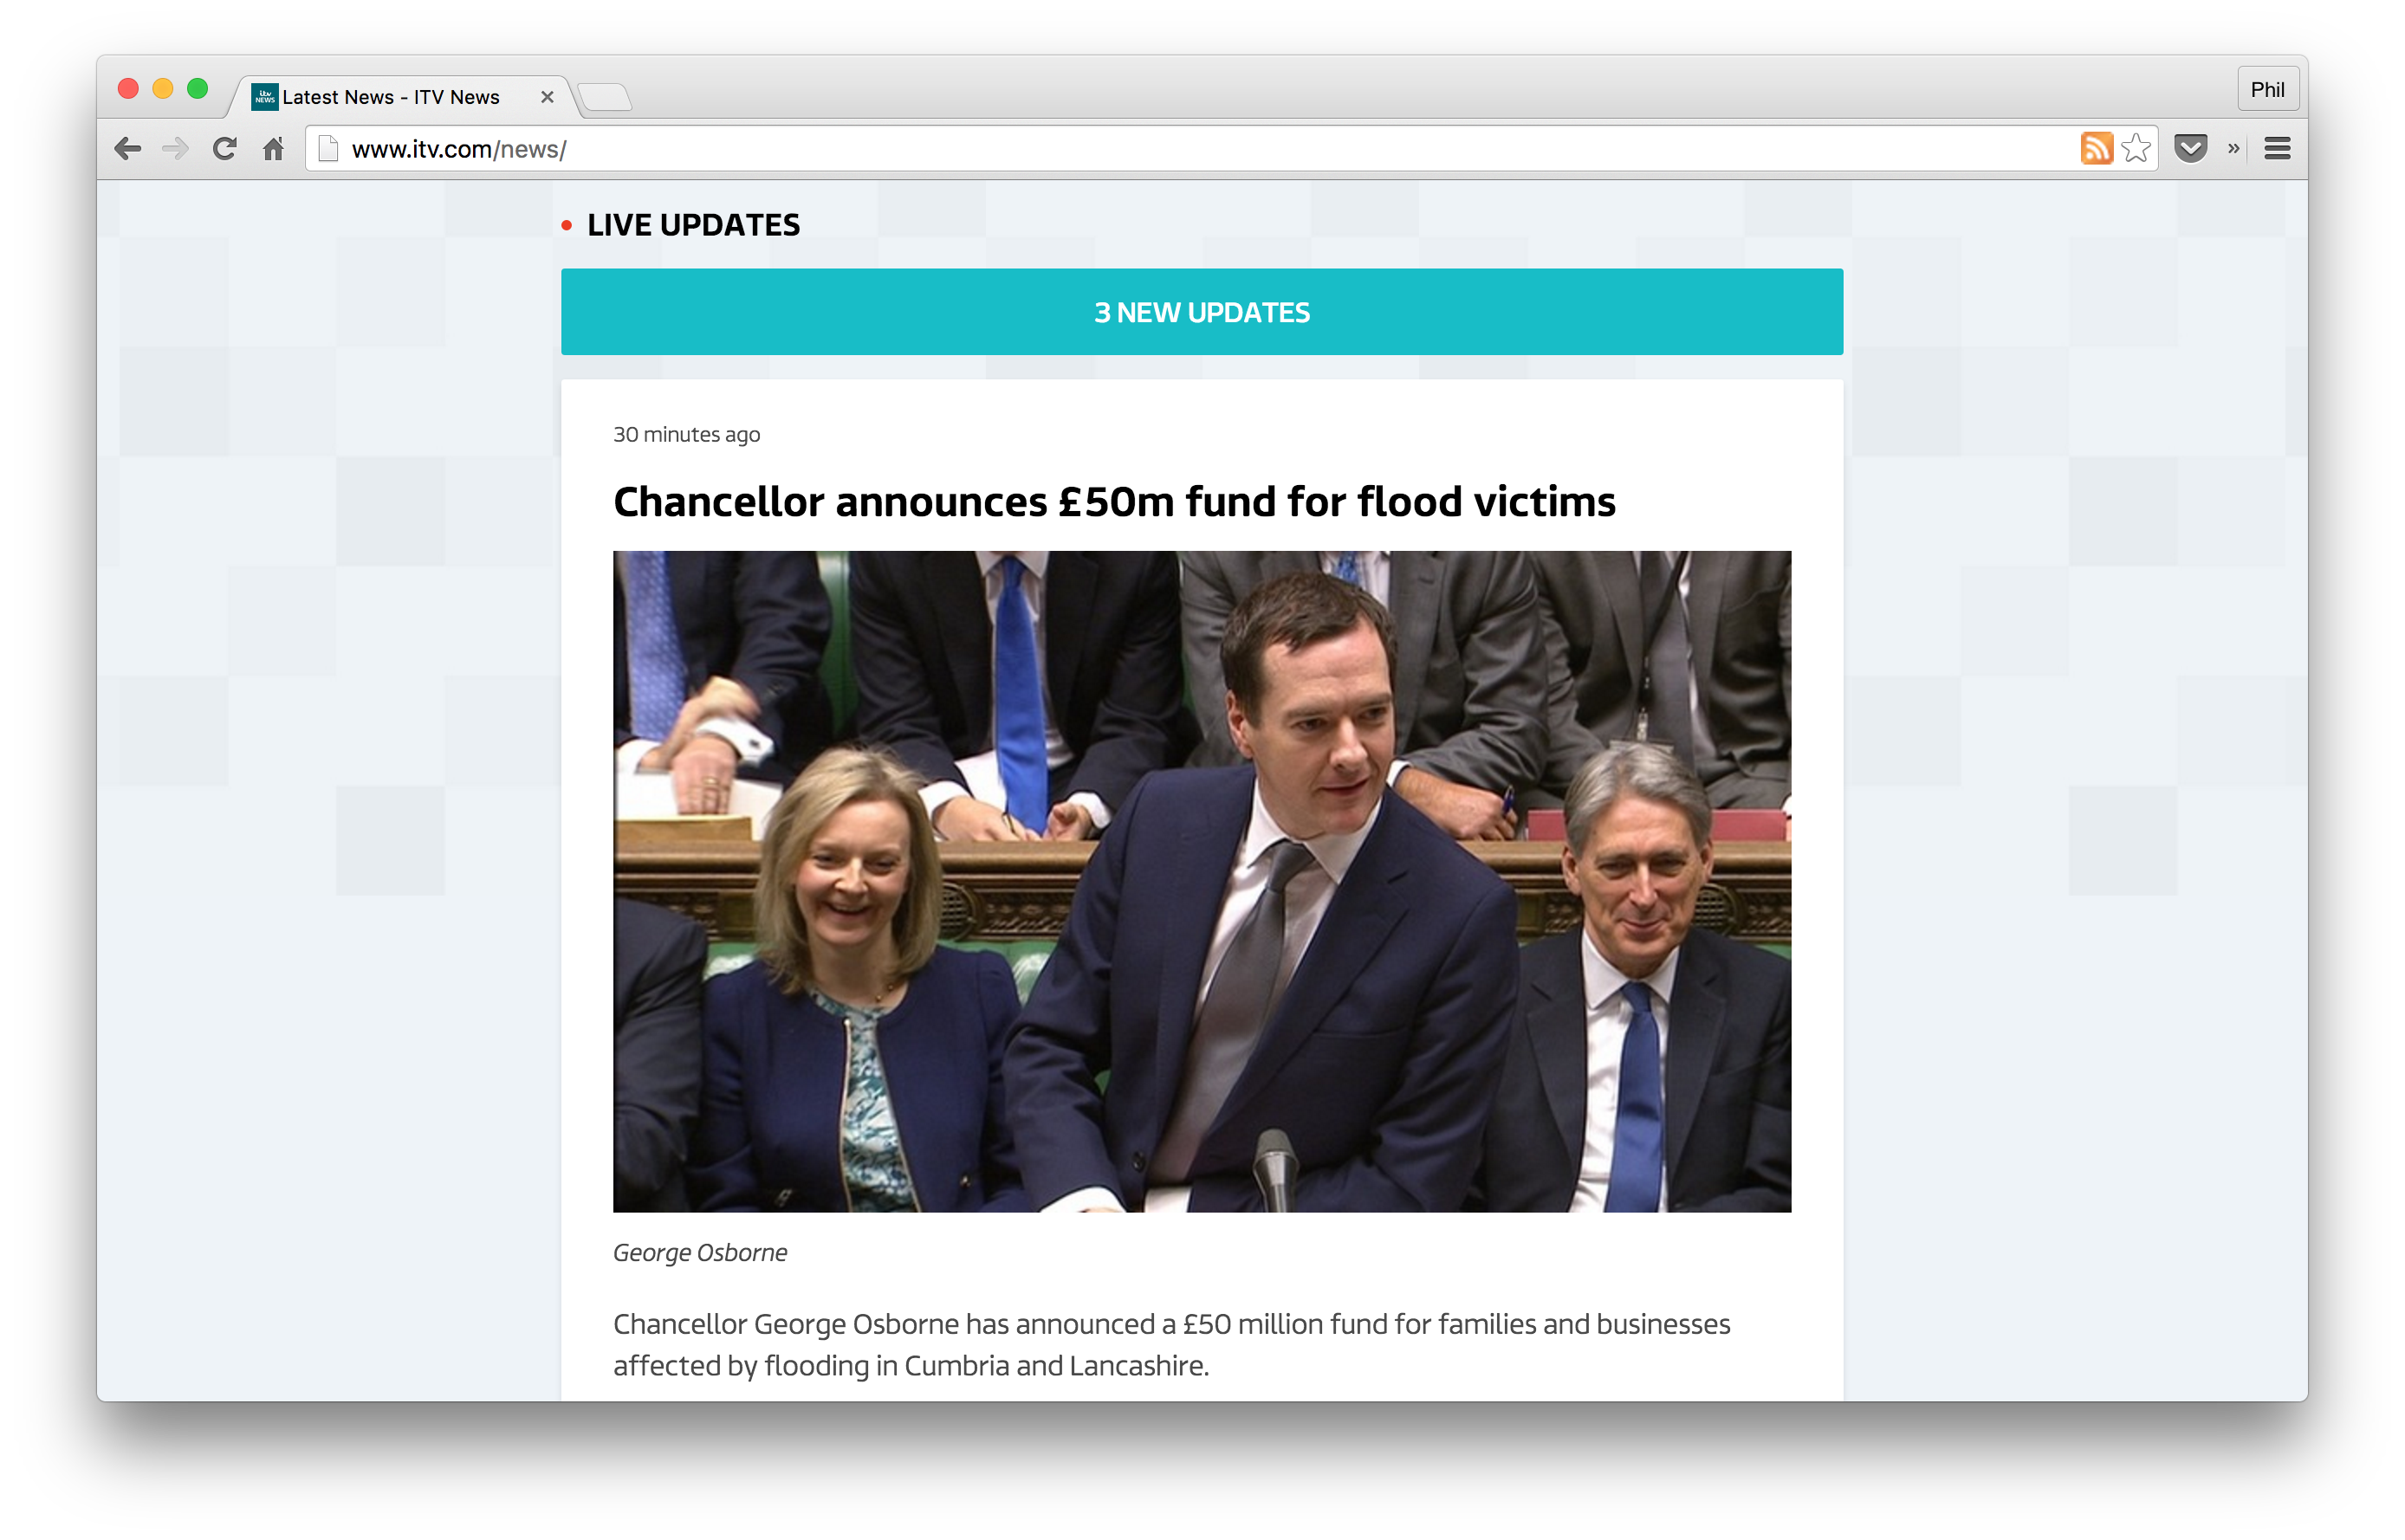
User notifications inform a user that something that they are interested in has happened or data relevant to them has changed. We’ve all seen the notification bar at the top of Twitter. ITV have used this to great effect on the live updates sections on itv.com/news where the notification bar is shown whenever an update arrives and when the user clicks the bar the new updates are shown in the app.
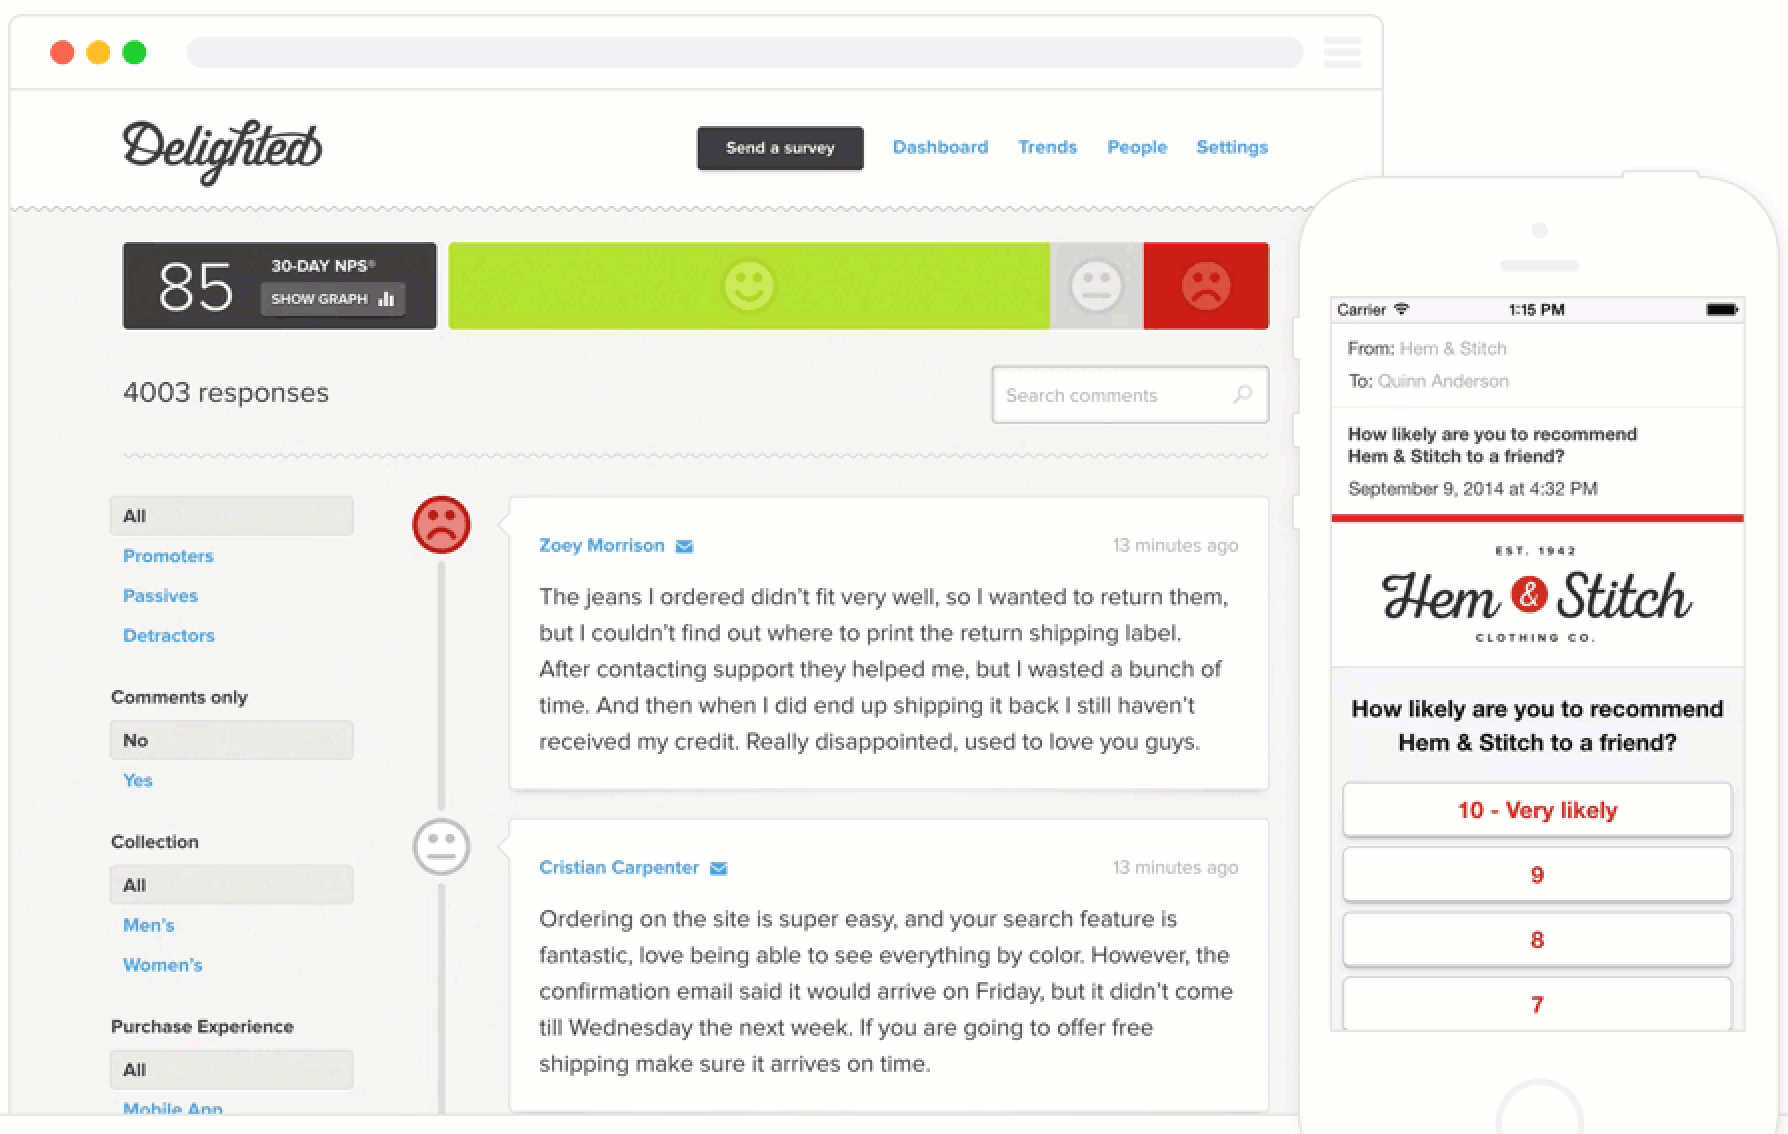
Popup notifications are also a common UI pattern that are seen across many applications, from social apps like Facebook to more workflow focused applications like Freshdesk, InVision, Intercom, Base CRM and many more.
Is there data within your application that would benefit from being instantly displayed as a user notification?
Activity Streams
An Activity Streams is the quintessential representation of a real-time UI. They show what has happened and what is happening right now as a stream of sequential activity, normally with older activities at the bottom and newer activities at the top. We see these on all social networks; Twitter, Google+, Facebook, Flickr and many more.
We also see Activity Stream UIs (sometimes referred to as an Activity Feed or News Feed) in news, sports and beyond; anywhere that there is a clear need to visualise activity. Live events are a great example. Whether it’s breaking news or a specific sporting event, you will see data represented as an activity stream with new updates appearing as they happen.
In all cases, a user is shown a stream of activity related to data that they are interested in. What have the people we are friends with, or are following, been doing and what are they doing right now? What has been happening with data related to my parcel? What user signups have taken place? What have the devices within my smart home doing? What’s the activity on a support ticket? etc. And what is happening related to those items right now?
Is there data within your system that would benefit from being displayed as an activity stream of actions, instantly updating as new activity takes place?
Data Visualisations & Dashboards
Human beings can generally better extract information from data if it is displayed in a visual form – not just as simple text. We often seen visualisations that help us interpret historical information and the same practice can be applied to real-time data.
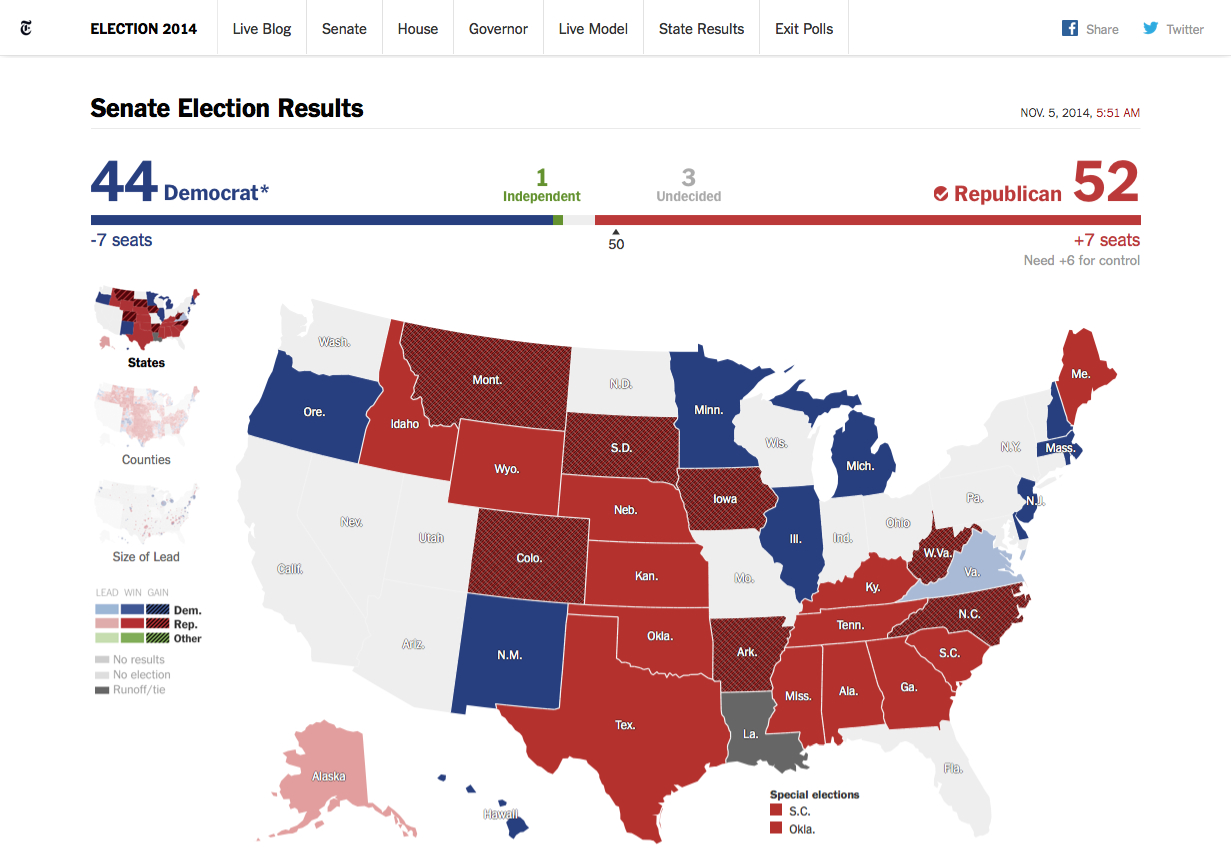
Adding real-time updates to a visualisation helps a user spot trends and changes in data that would be very difficult to spot through raw data alone. Seeing a dial move towards the green or red, a line starting to trend up or down, colours change on a map (such as in the New York Times example above), the area of a visualisation starting to grow or shrink or many more examples. All of these are great visual indicators and triggers that can help human beings be more aware of what’s happening, to identify changes and to act upon those changes as quickly as possible.
Do you have data within your applications that would benefit from being converted into a real-time data visualisation to help you or your customers see trends and take action sooner?
Interactive Communication
Real-time technology is frequently used to build chat and instant messaging solutions and we all know the benefit of being able to instantly communicate with work colleagues, friends and family.
Chat is a very focused form of interactions between users, but can be more generally thought of as interactive communication. We often partition chat into rooms or topics so that the conversation is focused.
In the context of your application, is there any real-time data that you could integrate into these conversations (chat/instant messaging) that would provide added context and help conversations become even more focused and productive? Could it actually trigger valuable conversations?
Multi-User Collaboration: Beyond Chat
One of the core benefits of realtime technology, and technology in general, is to improve and automate workflows that involved multiple people. We’ve seen this with project management, support systems, stock management, logistics and even applications such as document writing where Google Docs.
Collaborative applications save hours, if not days, when it comes to the time and effort required when working with others on completing a task or project. A great example of this is document collaboration: where previously we’d have to email a document around for others to make edits or comment we can now use Google Docs or Word in Office 365 to initially write a draft and then instantly start collaborating with others.
Real-time documentation editing is a very specific use case so you’re unlikely to be able to map the functionality it offers to the data you have (or maybe you can?). A more likely use case for your real-time data is to instantly send the changes in data to an application to inform your collaborators about what’s happening. Simple examples such as indicating that somebody else is editing a record can save time and avoid conflicts. Showing tickets in a project management system moving between stages in a workflow instantly indicates progress and can result in conversations or the next step in the workflow taking place.
Could you take your real-time data and improve your existing application workflows? Could you create visual representations of your workflows and enable real-time collaboration to further improve efficiency?
Real-Time APIs
APIs are big news. They fuel the software that’s eating the world, they are the new full time employees of many businesses and they super-charge your existing employees. So, where does your real-time data fit with the potential for offering a real-time API?
If you already have a real-time API then you can upgrade your API so that the initial GET requests also provide a mechanism for subscribing to future updates to the result dataset of that query. If you don’t have an API then you could expose the events you’ve identified within your systems as streams that other systems can subscribe to.
So, whilst you can build a new real-time feature on top of your real-time API, there’s the additional potential benefit of your customers now being able to get instant updates via an API and build their own applications and functionality on top of relevant data that you’re providing.
If you need more convincing you may be surprised to hear that a number of applications and services do already offer real-time APIs and they do so because they see a value in it. They know that companies want to add real-time features and experiences to their apps and they can only do that if they have real-time data.
See the video covering this in the so you want to build a Real-time API, where do you start? talk.
Next up: Setting Your Real-Time Data Free
In this post we’ve discussed the value of understanding what’s happening in your app right now and how you can expose your real-time data to help you get a much clearer understanding of that. We also looked at seven potential features (or even products) that you could build using your real-time data to make your product offering even more awesome; signalling, notifications, data visualisations and dashboards, interactive communication, collaboration and real-time APIs.
In the next post, describing, publishing and consuming real-time data, we’ll take the next step: how do you take your real-time data and expose it in such a way that you can start building real-time features?
This was originally written by me and published on the Pusher blog
